Business dashboards
Focused dashboards that turn scattered spreadsheets and exports into a single clear view of business performance.
We build simple dashboards and digital tools that help businesses understand their data and make better decisions.
What we do
We focus on tools that make sense to business owners and teams: no bloated systems, just clean reporting and useful websites.
Focused dashboards that turn scattered spreadsheets and exports into a single clear view of business performance.
Clean charts and visual summaries that make trends, bottlenecks, and opportunities easy to understand.
Practical advice on what to measure, how to structure reporting, and which metrics matter most to the business.
Portfolio preview
A preview of two analytics projects: one centered on secure multi-tenant reporting, and one built around automated ETL and dashboard delivery.

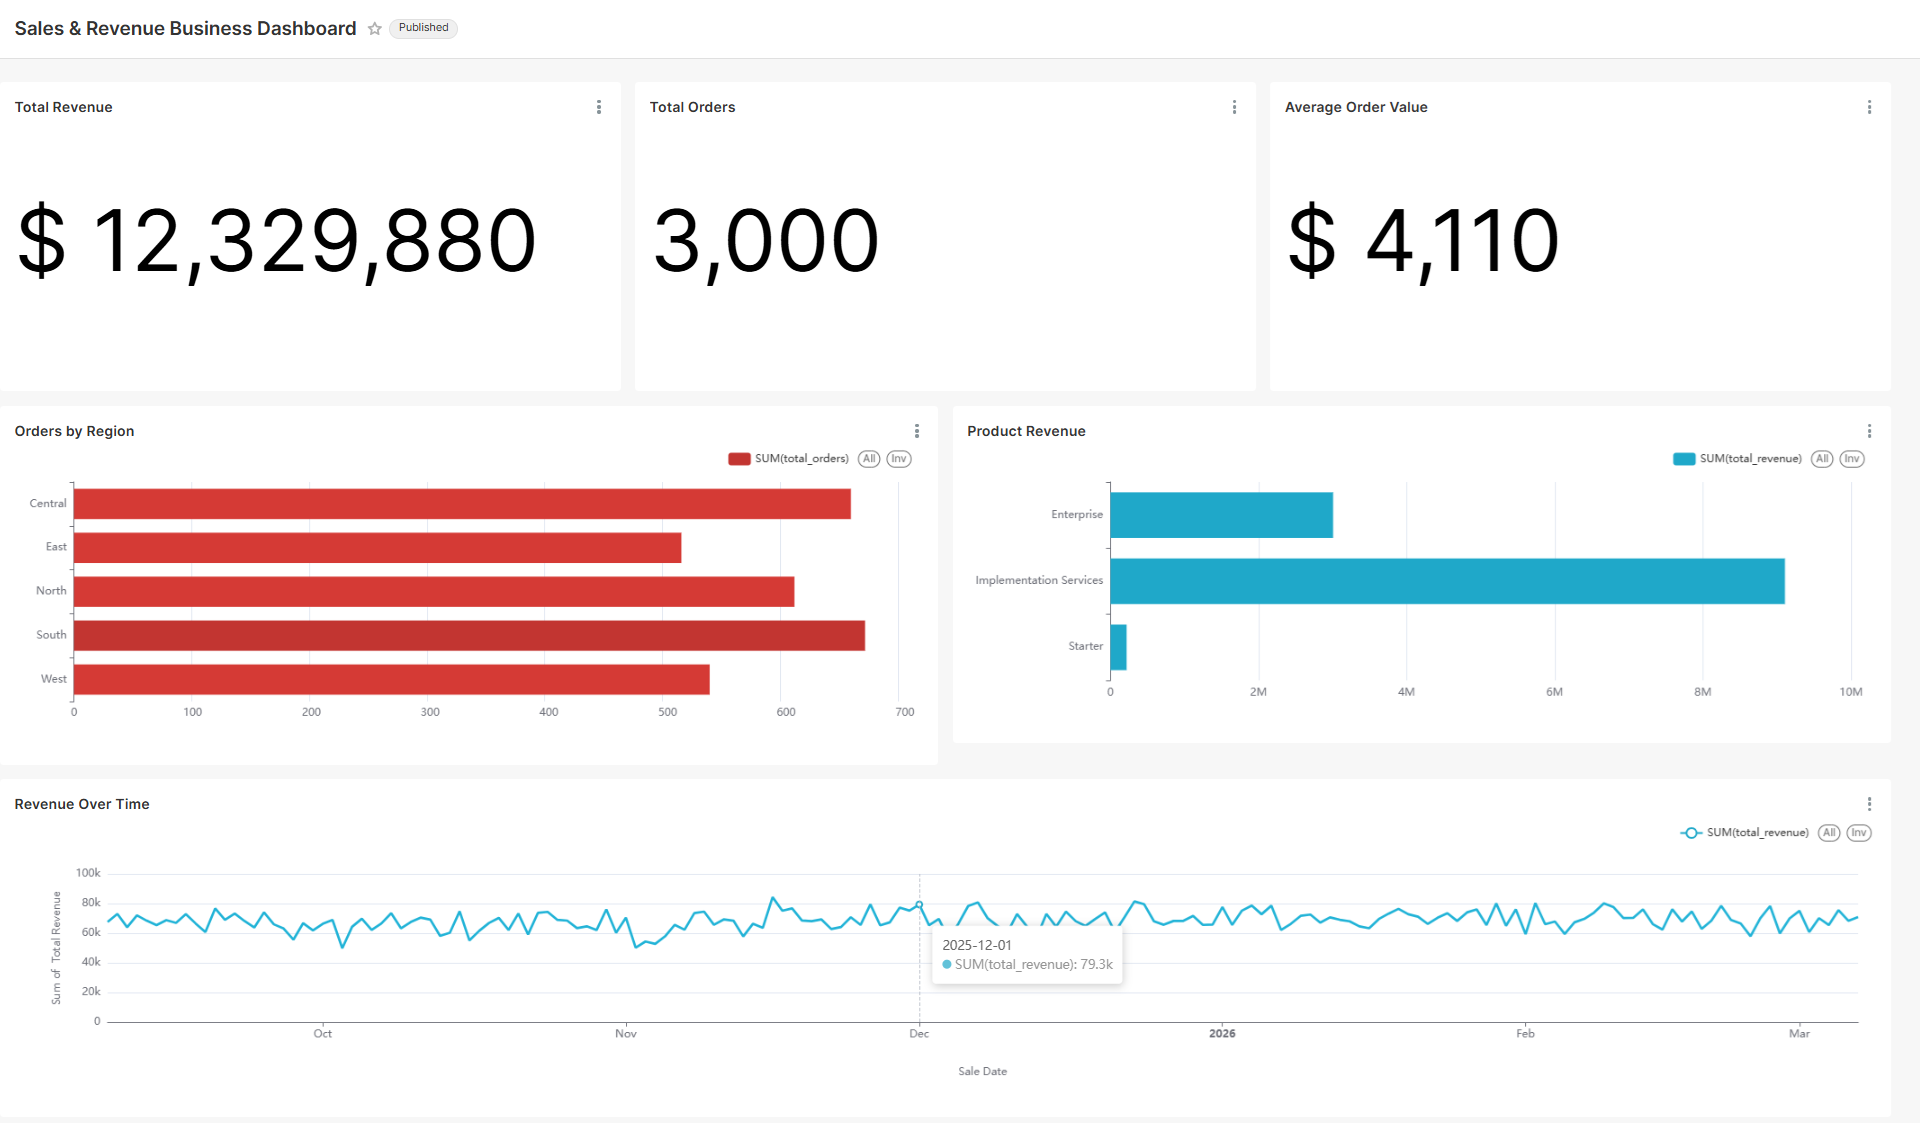
A production-style Apache Superset dashboard with role-based row-level security so each region only sees its own sales data.
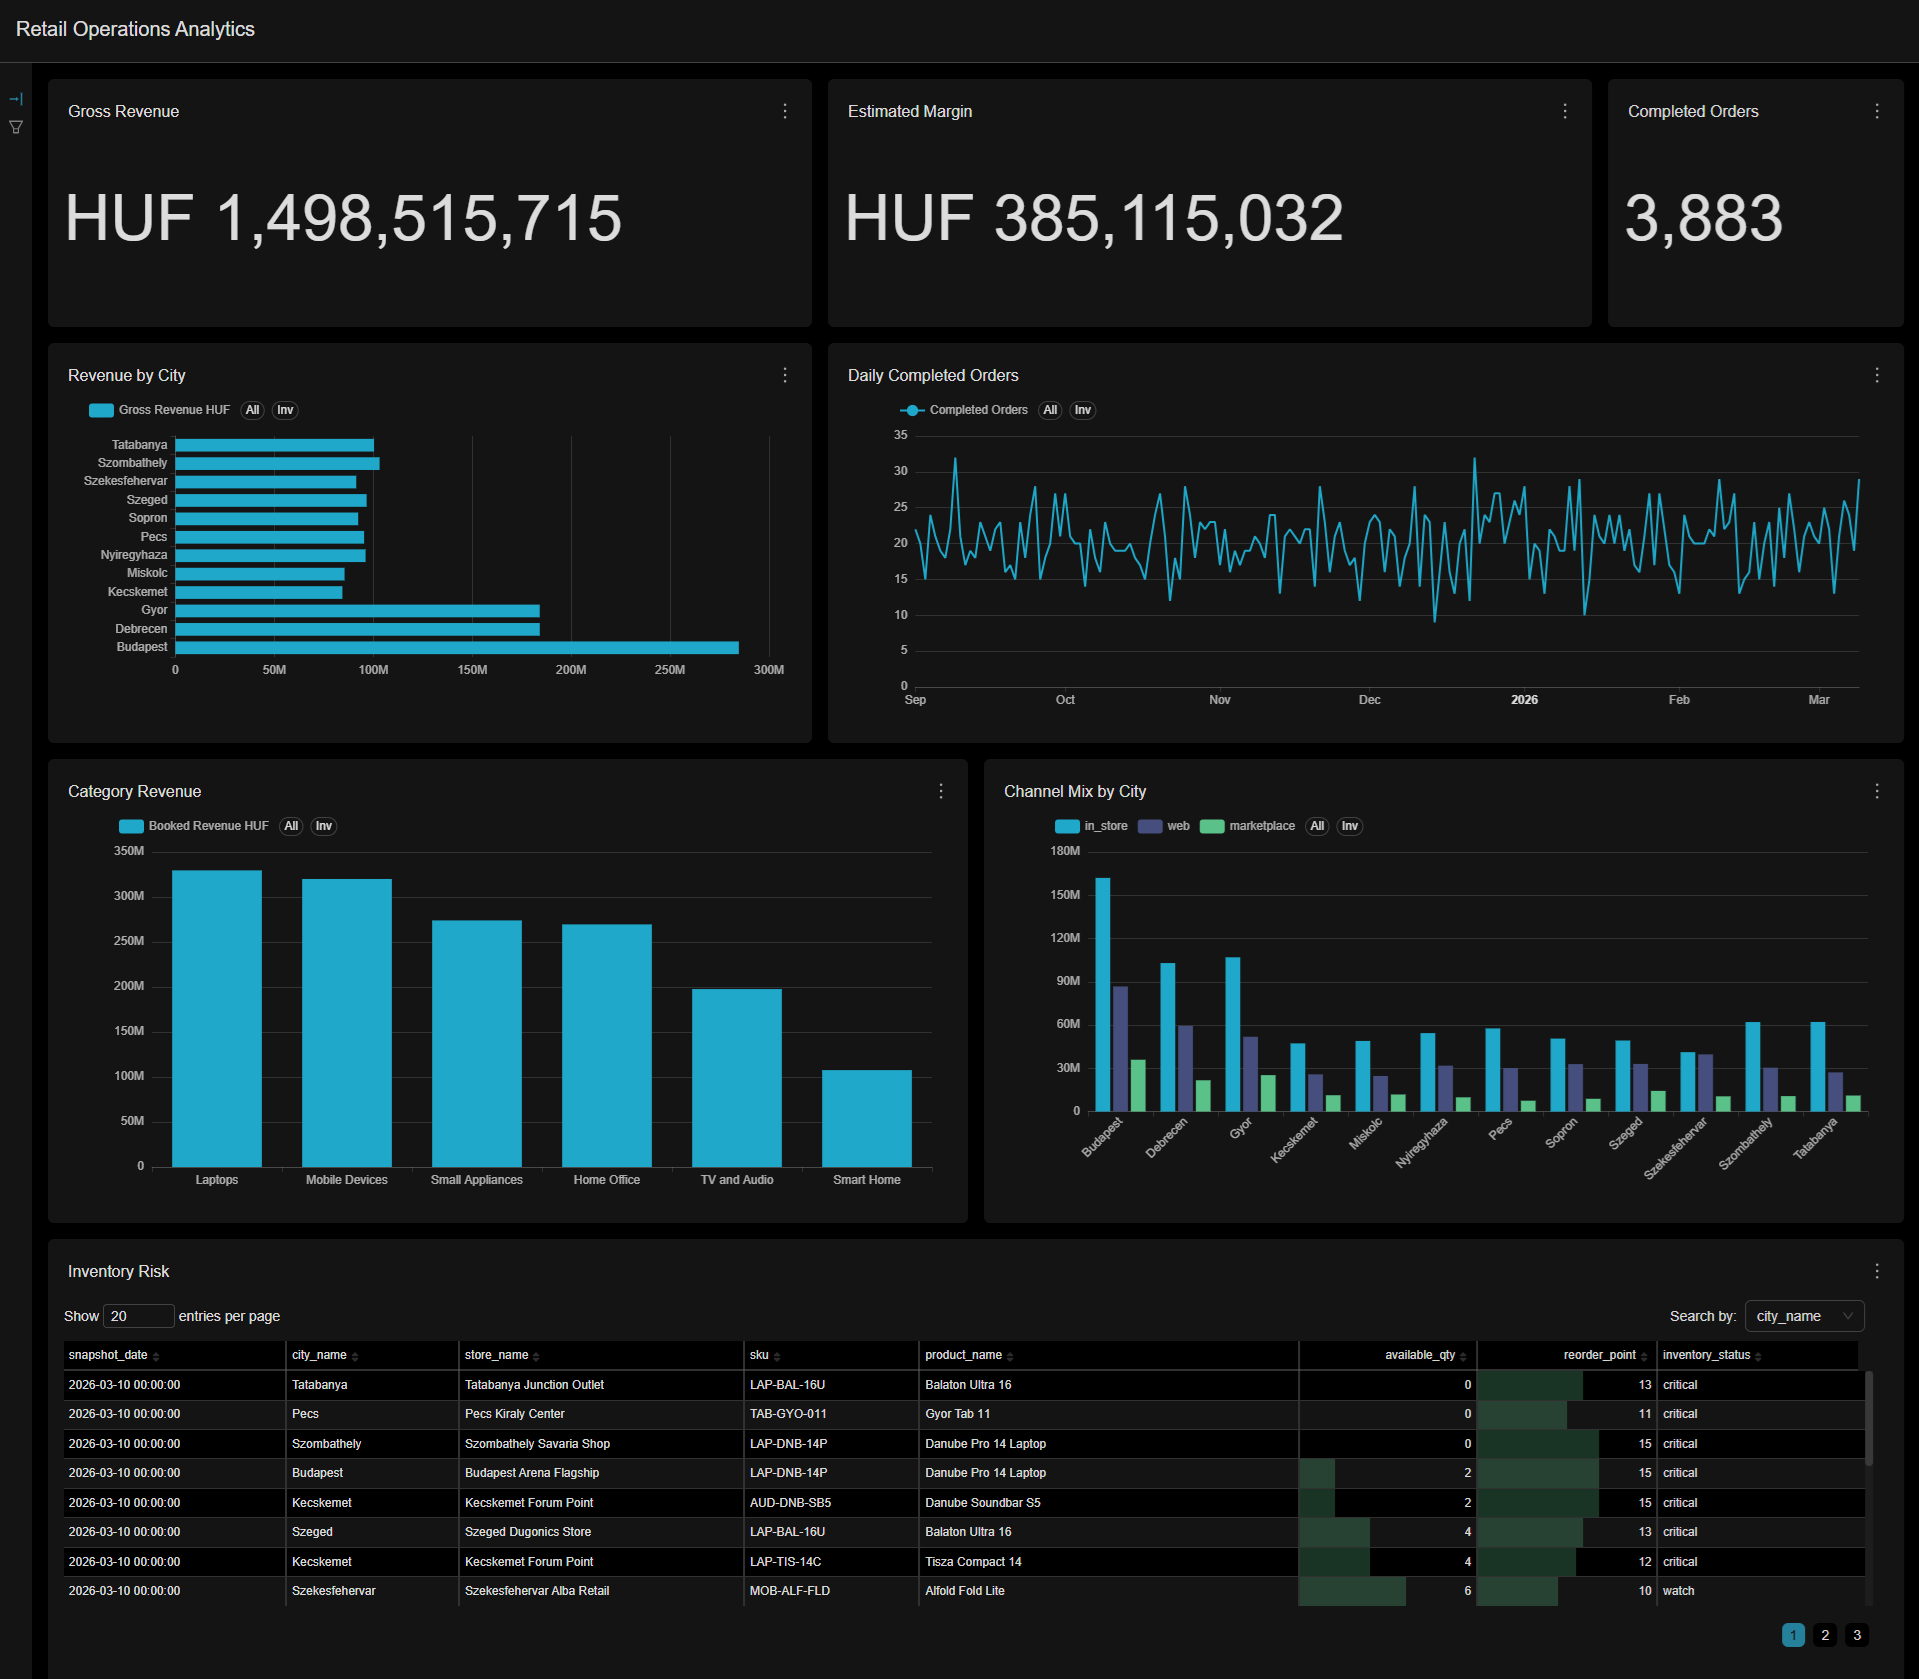
An automated sales analytics dashboard powered by Python ETL, PostgreSQL, Celery, Redis, and Apache Superset.
How we work
You send the data source and the metrics you want to track. I review the structure, prepare the data, build the dashboard, and deliver it for review and revisions.
Share your Excel, CSV, Google Sheets, or database source together with a short note on the metrics you want to track.
Your data is reviewed, cleaned, and structured so the dashboard can be built around the KPIs your business actually needs.
You receive the completed dashboard, review the work, and request revisions so the final result fits your business needs.
Packages
Every package can be delivered in Microsoft Power BI or Apache Superset, depending on your workflow, hosting needs, and reporting goals.
Starter
$120
A simple dashboard for core business metrics like revenue, orders, customers, or cashflow.
Standard
$320
A broader dashboard package with more charts, multiple views, and richer interactive reporting.
Advanced
$650
A more complete reporting setup for businesses that need deeper insights, embedding, and a polished delivery.
Ready to simplify your data?
Plus Source helps small and medium businesses replace scattered spreadsheets with focused reporting and clean, practical tools.